Massive Slow Down of LHCb upgrade HLT1 sequence running with TImeLineSvc on
Throughput tests for the LHCb upgrade relies on the TimeLine Service. We run Brunel multithreaded with Hive. Since commit bcfd63db in Gaudi, we started to observe that the endTime in the timeline service file was always set to 0 (Issue #14 (closed) ). The problem has been fixed in !610 (merged) , nevertheless this leads to wrong results. Also the throughput measured move from 6000 evt/s/node to 200.
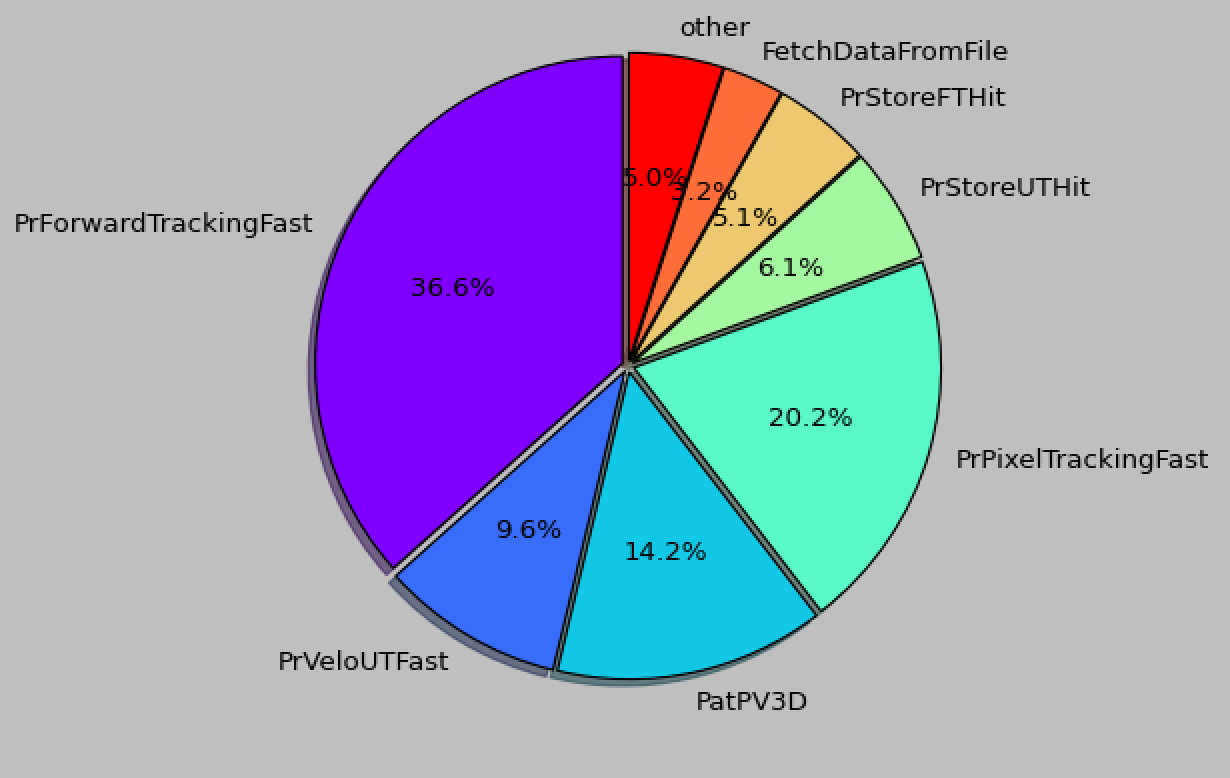
In attachment the HLT1 sequence timing distribution among algorithms from Gaudi at bcfd63db commit and the one obtained with the current master.

Can we ping down what is going on? @ishapova , @sponce , @clemenci, @graven
Activity
mentioned in issue #14 (closed)

Hm. Do you observe the throughput regression only with enabled
TimelineSvc? If yes, then it looks like the new mechanism has poor scalability, though the extent of the latter is pretty unexpected. How many algorithms in flight did you run per process in those tests?How does throughput change if you protect the whole loop with
if (e.end.time_since_epoch().count())?Edited by Illya Shapoval
@chasse tried to run without the TimeLineSvc and the throughput is higher. I have not yet tried to protect the loop you talk about.
assigned to @clemenci
mentioned in merge request !620 (merged)
mentioned in merge request !610 (merged)
changed milestone to %v30r2
@ishapova, after my investigation we realized that the problem with the loop is that it goes through all entries in the timeline, so more events you process the more it takes time.
The protection you suggested would prevent the loop on the first call to
registerTimelineEvent, but you still have to loop over a few thousands entries on the second call.With !620 (merged) I get back the original speed, and simplify the use of
TimelineSvcinAlgorithm. I believe that theTimelineSvcshould be simplified even more, e.g. makingTimelineEventan implementation detail rather than part of the interface (!620 (merged) is WIP because I have to decide if to try the refactoring now or wait more).-
after my investigation we realized that the problem with the loop is that it goes through all entries in the timeline, so more events you process the more it takes time.
I thought I pointed to this a week ago, by the nature of the suggested quick fix. It is sort of obvious that the problem with the loop is that it is... a loop. If I knew the service is used for what it was never supposed to be used - to average the runtime over zillions of events - I would focus on this aspect more and, at least, would have made the loop reversed, giving the search step the amortized complexity of O(1) in this special case (events are pushed back), or would have done even deeper refactoring.
But, again, I remember all discussions at the time the service was introduced. The main motivation for the service was not cumulative profiling, but tracking concurrent inter- and intra-event occupancy patterns of algorithms' execution flow occurring in a narrow time window. In the end, can't the average algorithm runtimes (diagrams reported in this issue) be measured by the standard Gaudi time auditors? Why do you need to track and dump slot, event and thread IDs, even the explicit start and end points, for that?
I'm not saying that these two orthogonal use cases of the service can't co-exist efficiently - they can - but just explaining why the cumulative/averaging use case was somewhat unexpected.
The protection you suggested would prevent the loop on the first call to
registerTimelineEvent, but you still have to loop over a few thousands entries on the second call.Well, sure thing, but note that, despite the searching in the second call, it would restore the
end-startdelta, b/c the time points would be taken before the searching. Throughput is the only thing that could potentially be not restored entirely (and that's why I was asking to run a quick test to check the extent of this). However, even though you confirmed you don't measure throughput by means of theTimelineSvc, it could also be fully restored for the sake of quicker tests by adding the reversed loop, or by going for point (1) in my comment here.I thought the problem was urgent, so suggested a quick fix on that weekend, that could be easily checked in your specific scenario without the MR loop.
With !620 (merged) I get back the original speed, and simplify the use of
TimelineSvcinAlgorithm.Yes, I saw. Much better than Daniel's initial implementation and my recent changes altogether. I like it.
Edited by Illya Shapoval mentioned in commit 40d82b4e
closed via commit f320f54d
mentioned in issue #237 (closed)