Add two new HLT framework online monitoring histograms in TrigOpMonitor:
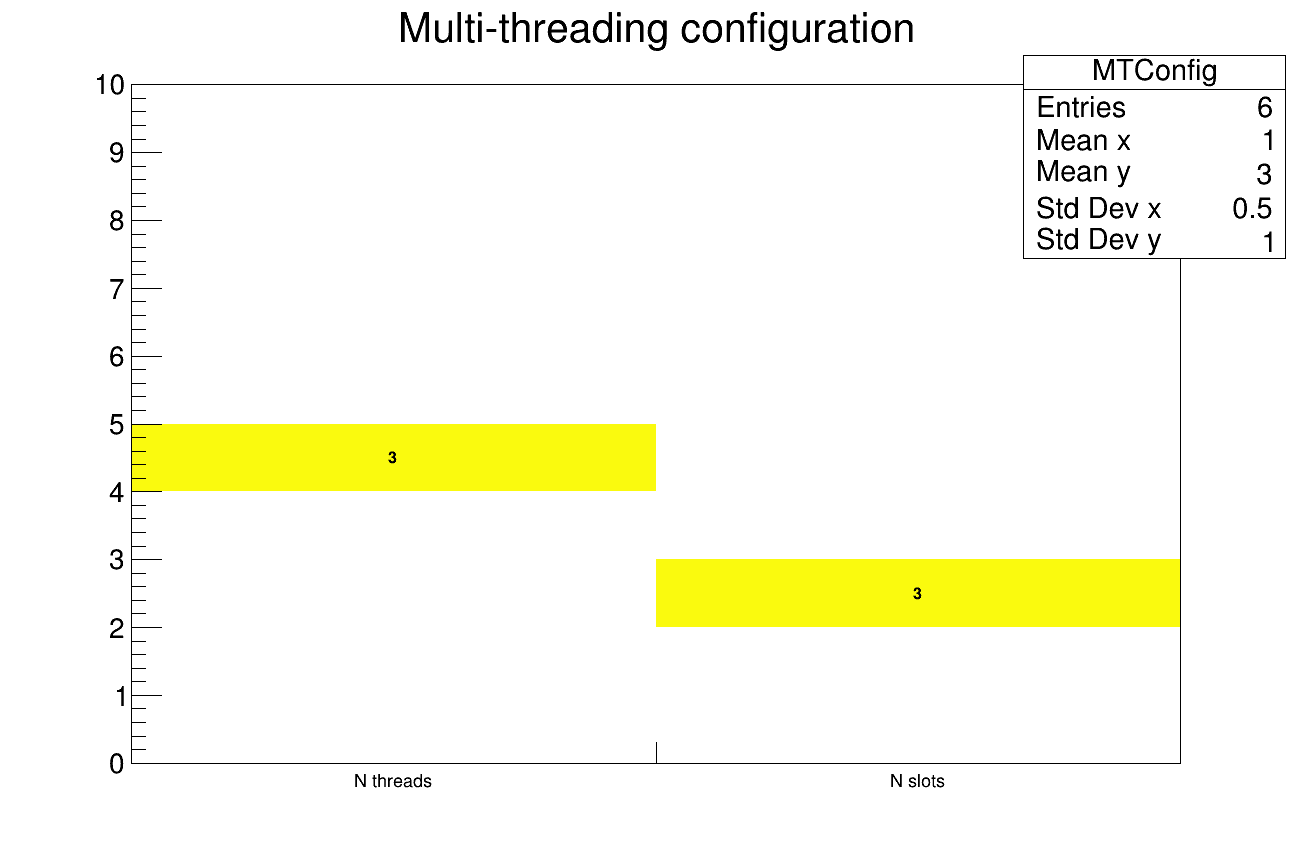
MTConfig - showing number of threads and slots in each HLT worker
MPWorkers - showing ID of each HLT worker, which allows to determine how many workers there are per HLT node
It is not possible to monitor the number of forks directly on the athena side, but the information can be easily deduced by just looking at the worker IDs from the latter histogram.
Motivation
It came up during one of the Technical Runs at P1 that it would be useful to determine the MP/MT configuration while running by just looking at the online monitoring histograms. Otherwise, the configuration is only present somewhere in OKS and one needs to know where to look for it.