Results with different viral load values
Added the probability of infection given a certain viral load results to the report_generator.
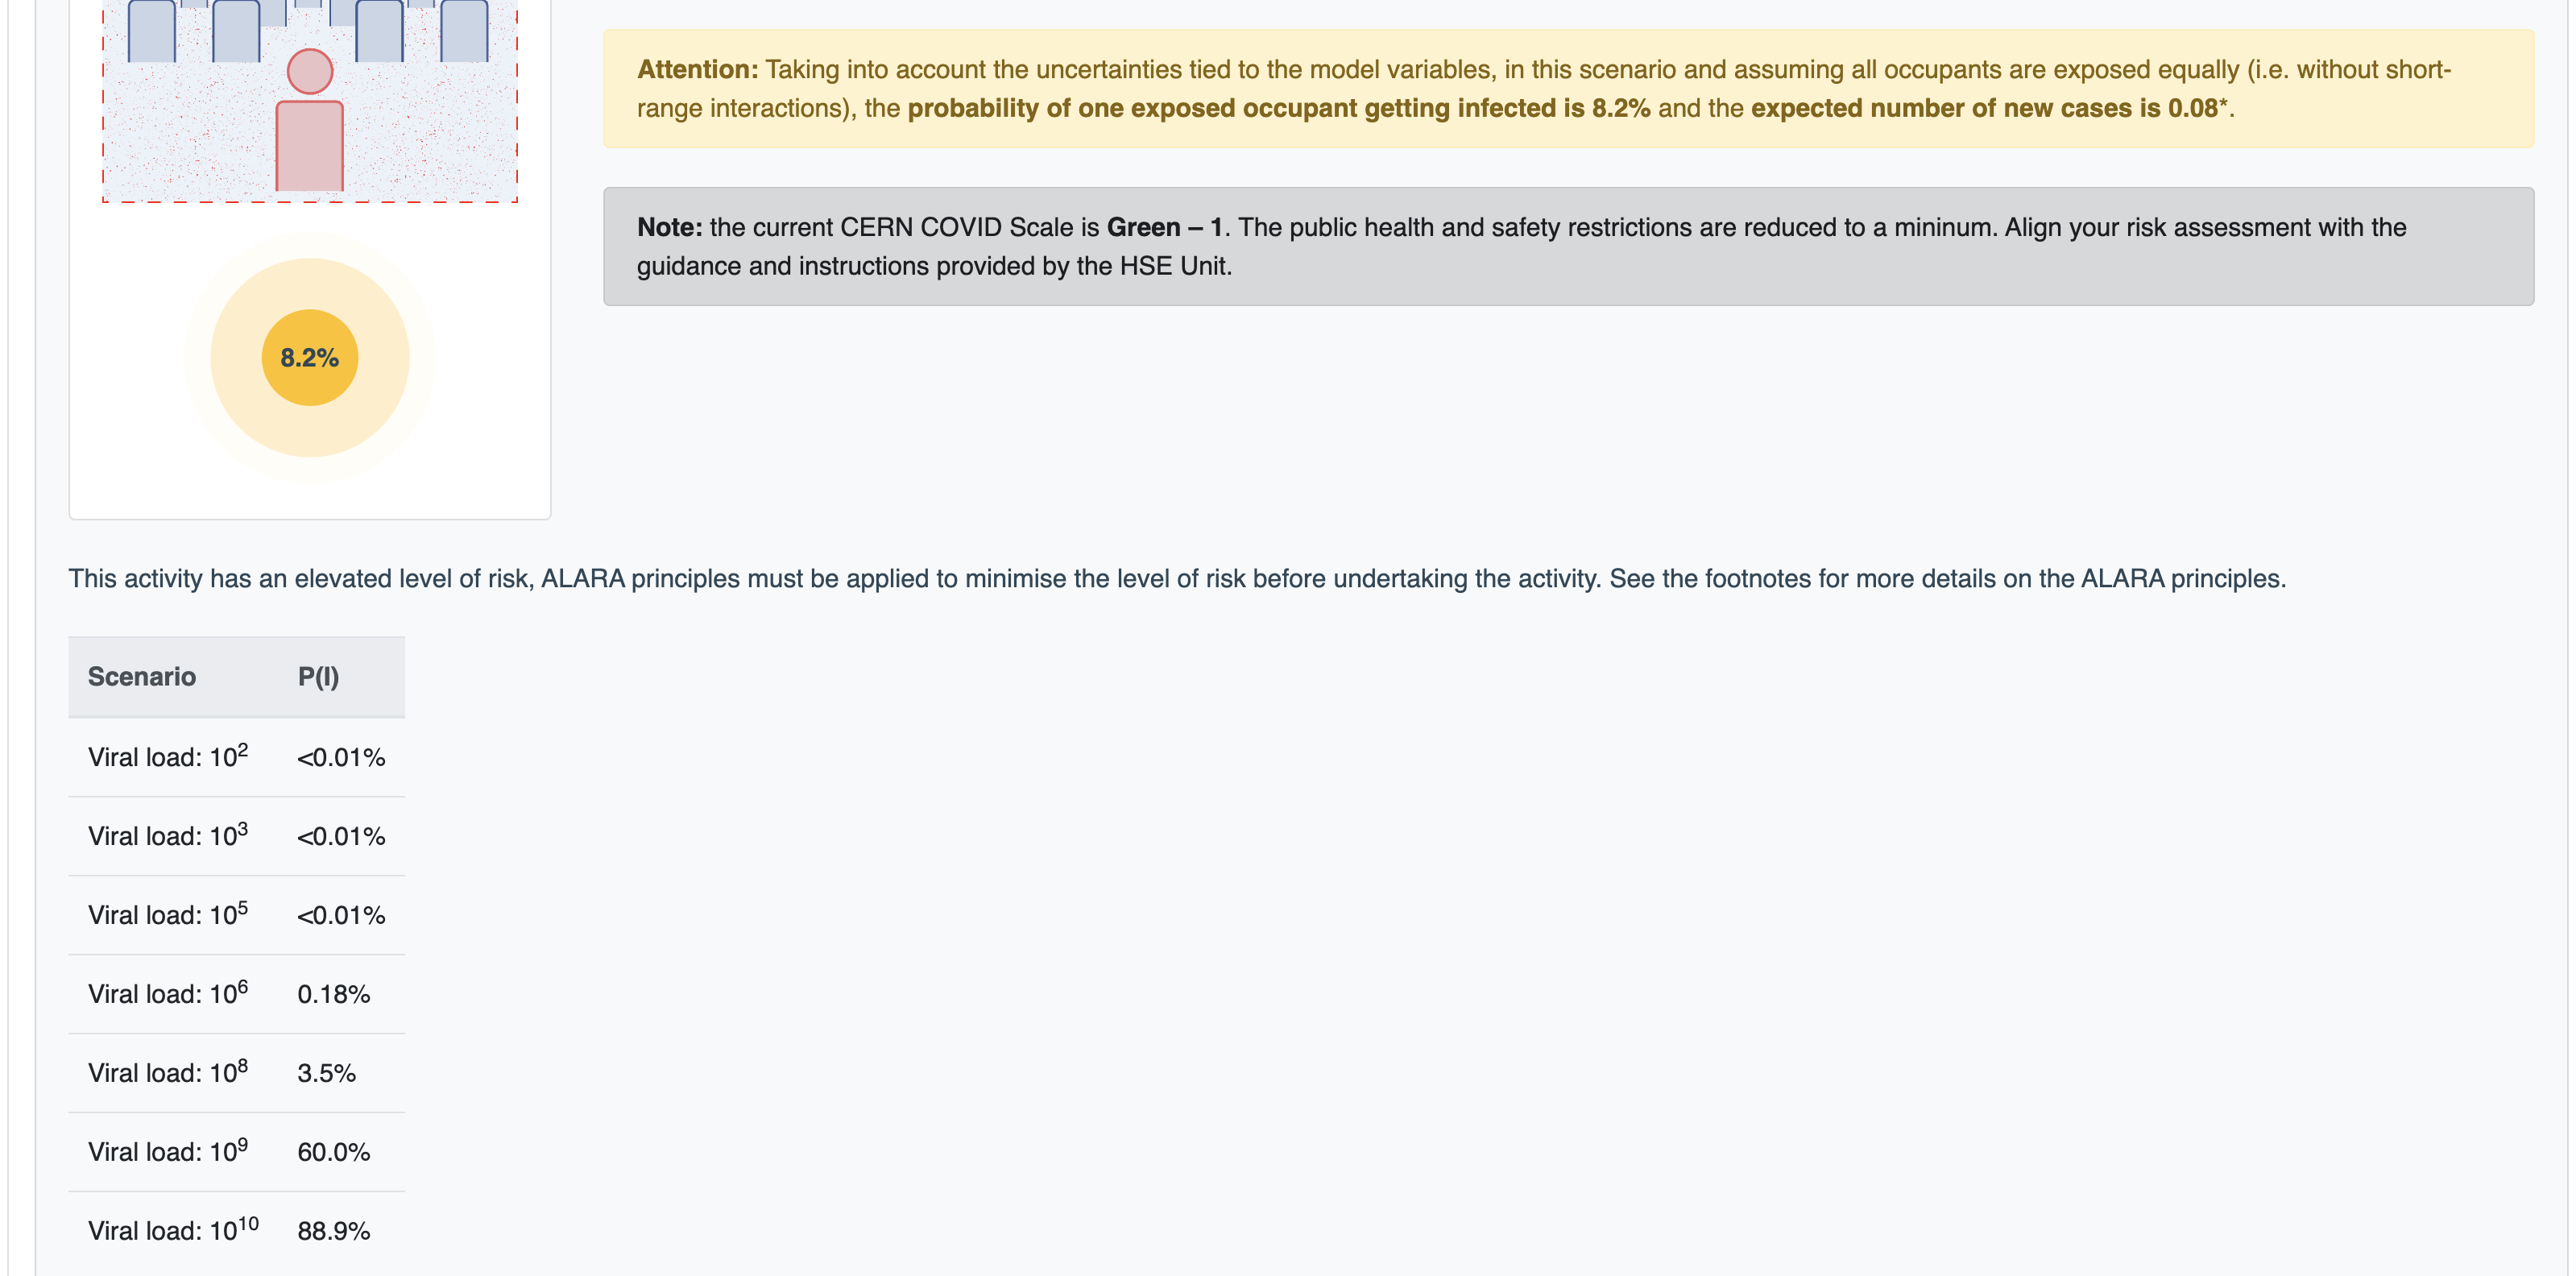
In this MR, the viral load values used to calculate the probability of infection are the 1st, 5th, 25th, 50th, 75th, 95th and 99th percentiles. Please note that these calculations are only performed based on a form condition - conditional_probability_viral_loads (when is evaluated to True).
Given that there it is not desired to have this results on the BASE/CERN user-interface, this MR only applies the module changes. However, the following image is a possible draft for the report:
This MR is similar to the P(I|Vl) plot generation with matplotlib - however independent, given the different viral load values (distribution vs. quantiles).
Edited by Luis Aleixo