Overall architecture
Summary
We need to settle on the architecture of the analysis suite.
On the input side, we will need to handle several GB-level files for scans using tracking data (latency, S-curves...), or one (?) small file generated by cmsgemos for non-tracking data scans (can't find an example on top of my head).
On the output side, we will output either plots or text files to be digested by cmsgemos. The largest such file would contain the thresholds for all 128 channels of every VFAT. That's about half a million integers, which would produce a ~2MB JSON file.
Proposed solution
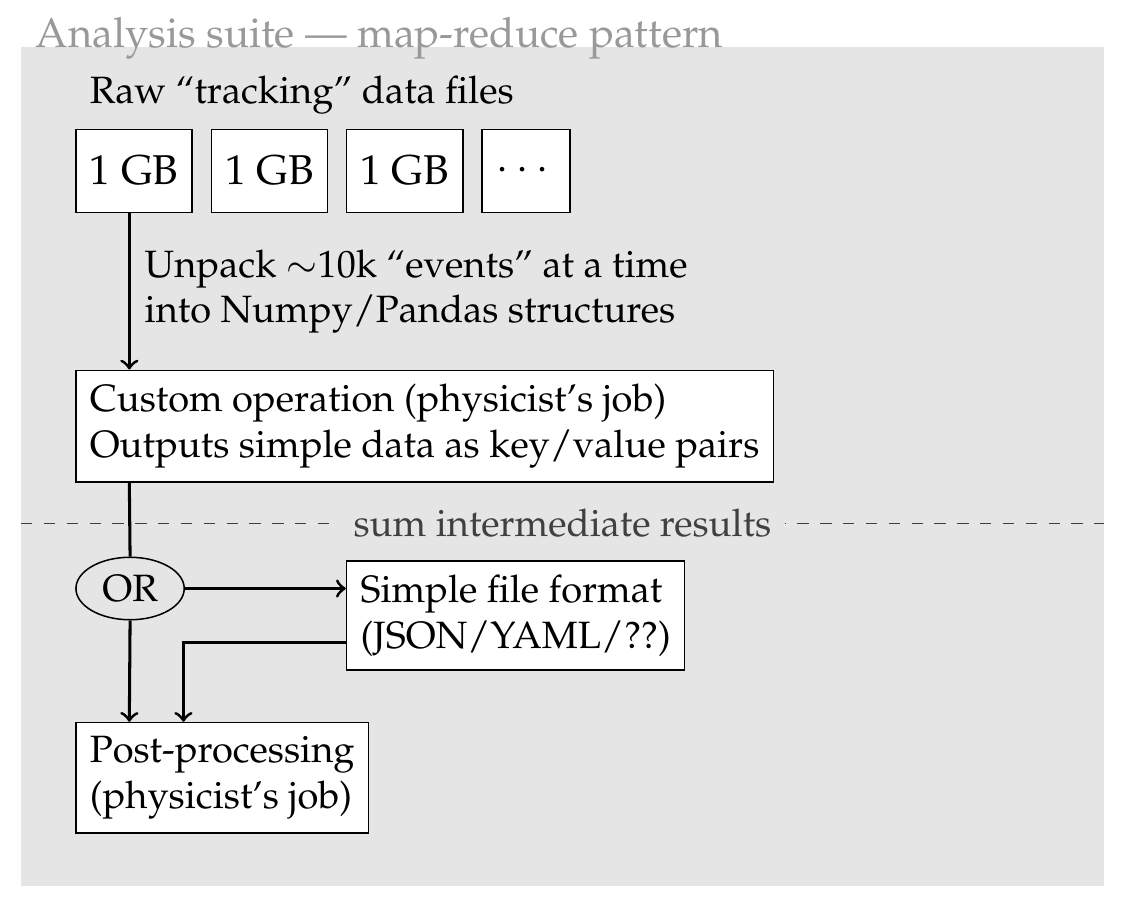
It would be valuable to divide the analysis in two steps:
- Histograms are filled from the contents of the tracking data files. They are saved to disk.
- A post-processing step is applied to histograms to extract the parameters of physics interest. Ideally the dirty bits of reading histograms from disks are abstracted away.
This two-steps process would facilitate iterations during development, because the histogram files could be used many times without unpacking everything again. Care should be taken that the analysis applied in step 2 uses the correct type of histograms...
There should probably also be a convention on where to put plots (and corresponding helper functions), since we'll likely be able to produce thousands of them.
This architecture is what I drafted in my slides today:
What is the expected correct behavior?
We have a well-defined architecture that we can move forward implementing!